
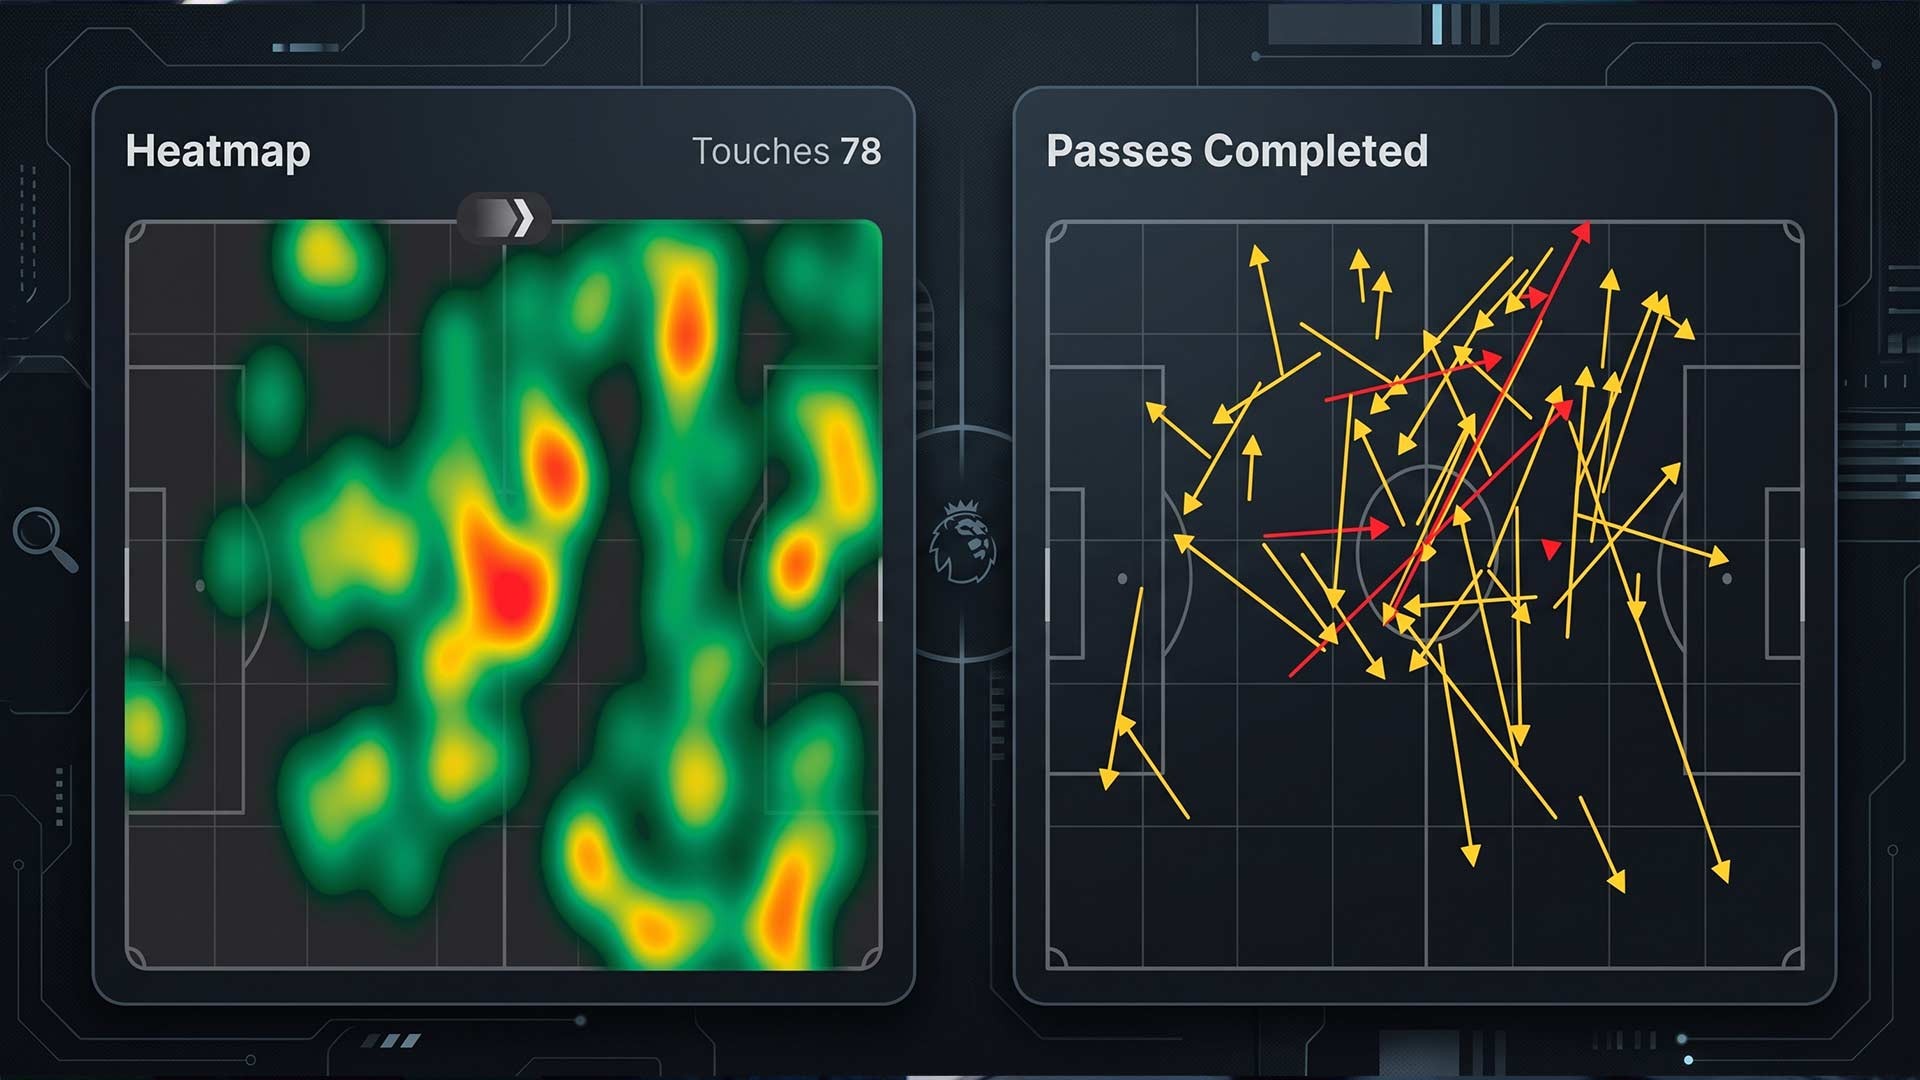
Everyone Has the Same Spreadsheet
If mathematical solvers and fixture matrices are the science of FPL, Role Watch is its qualitative alpha: evaluating how a manager is deploying a player across the different phases of play, so you can spot a structural shift before the data engines register it. The best live example this season is Pascal Groß, and we'll use him throughout, along with our own model's numbers, the elite managers' ownership data, and the moments where the neat version of the story doesn't quite survive contact with the facts.
1. The Latency of Expected Metrics
Predictive algorithms and most managers treat a player's profile as a stable baseline. If a midfielder averaged 0.22 xGI per 90 last season, his baseline for the next six weeks is assumed to be roughly 0.22, nudged up or down for fixture difficulty.
Football doesn't work like that. A manager changes his defensive midfielder, switches his build-up shape from a 3-2 to a 2-3, or tells an inverted full-back to hold the touchline instead of underlapping. Overnight, a player's functional job changes, and with it, the kind of chances he gets.
Models are deliberately slow to believe that, and for good reason. Five matches of xG is a tiny, noisy sample; most early-season spikes are variance, and a model that chased all of them would be worse, not better. So every serious projection engine shrinks new evidence towards the old baseline:
A role is a cause, not a sample
That shrinkage is correct for noise. It's badly wrong for a genuine role change, because a role isn't a statistical sample that needs to converge. It's a cause. If you can see that a player now starts attacks deeper, finishes them higher and has a new teammate covering the space behind him, you don't need eight matches of xG to confirm the mechanism. You need the eye test to confirm it once, and the numbers to confirm it isn't a mirage.
Our own projection engine has now moved Groß to roughly 0.54 xGI per 90 across the next six gameweeks, which is most of the way to his current output. It got there, but look at what the market charged anyone who waited for it:
| Gameweek | Deadline | Groß price | Top-1k owned | Top-1k started | Points |
|---|---|---|---|---|---|
| GW1 | 21 Aug | £5.5m | - | - | 2 |
| GW2 | 28 Aug | £5.5m | 44.6% | 26.1% | 13 |
| GW3 | 4 Sep | £5.5m | 52.8% | 46.4% | 1 |
| GW4 | 12 Sep | £5.6m | 73.5% | 72.9% | 17 |
| GW5 | 18 Sep | £5.7m | - | - | 14 |
📌 Price at each deadline from FPL price-change history (rises on 9, 15 and 19 September; £5.8m today). Top-1k = FPL King's capture of the top 1,000 overall at each deadline (GW1 and GW5 snapshots aren't available for this sample). Overall ownership today: 27.7%.
The elite were early: 44.6% of the top 1,000 already owned him by the GW2 deadline, while he was still £5.5m. But even they hedged. Only 26.1% started him that week, which means roughly two in five elite owners watched his 13 points from the bench. By GW4, 73.5% owned him and he'd started to rise. He's now had three price rises in ten days and more than 670,000 net transfers in this gameweek alone. That last wave isn't Role Watch. It's the algorithm arriving.
 THE LATENCY PIPELINE: PASCAL GROSS, 2026/27
 │
 ├── STAGE 1: the role changes on the pitch ......... GW1–2
 │     £5.5m · barely visible in the data yet
 │     ▶ ROLE WATCH BUYS HERE
 │
 ├── STAGE 2: territory changes (box arrivals) ...... GW2: 13 pts
 │     £5.5m · top-1k owned 44.6%, but only 26.1% started him
 │
 ├── STAGE 3: xG and xA confirm it .................. GW4: 17 pts
 │     £5.6m · top-1k owned 73.5%
 │
 └── STAGE 4: models and the crowd catch up ......... GW5 onwards
       £5.8m · 670,000+ net transfers in a single gameweek
       ▶ THE ALGORITHM BUYS HERE
If you wait for the xG to confirm a role change, you pay full market price for it: in money, in ownership, and in the fixtures you've already missed. If you evaluate the role directly, you capture the early hauls at a fraction of the ownership.
2. The Five Pillars of Tactical Role Analysis
A proper Role Watch looks past who took the shots and who took the corners. Structure your eye test and your match notes around five questions. The first four are about how the player moves; the fifth is about the pecking order around him. For each one, there's a number that lets you check the eye test isn't fooling you.
I. Initial phase vs terminal phase
Track where a player starts an attack and where he finishes it. In Phase 1 (first-line build-up), does the midfielder drop between the centre-backs to collect from the goalkeeper? In Phase 3 (box entry), where is he when the cut-back or the cross arrives?
A player who drops deep in Phase 1 is easily dismissed as "a defensive midfielder". But if the same player sprints 40 yards to become the third man crashing the penalty spot in Phase 3, his ceiling is far higher than his heat map suggests. Understat gives you the cleanest single number for this split:
| Player | Build-up (last) | Build-up (now) | Threat (last) | Threat (now) | Read |
|---|---|---|---|---|---|
| Groß (BHA) | 83% | 41% | 0.25 | 0.66 | Into the box |
| Tavernier (BOU) | 46% | 26% | 0.46 | 0.66 | Into the box |
| Haaland (MCI) | 16% | 18% | 0.94 | 1.08 | Unchanged |
| Gvardiol (MCI) | 95% | 88% | 0.15 | 0.26 | Freer |
| Wirtz (LIV) | 52% | 73% | 0.48 | 0.31 | Deeper |
| Rice (ARS) | 70% | 96% | 0.34 | 0.14 | Much deeper |
📌 Understat, 2025/26 season ('last') vs 2026/27 through GW5 ('now'). Threat = non-penalty xG + xA per 90.
That's the whole Role Watch thesis in six rows. Groß's involvement used to end in build-up: 83% of the xG he touched came from possessions where someone else took the shot or played the final pass. This season it's 41%, and his threat per 90 has more than doubled. At the other end of the table, Rice's build-up share has risen to 96% and his threat has more than halved. Same player, same shirt, a very different job.
II. Positional freedom and half-space hunting
Is the player pinned to a structured lane, or does he have licence to roam? Wingers told to hold extreme width to stretch a low block pile up touches, but mostly low-value touches, and crosses into a packed box rarely turn into big xA. Players given freedom to drift into the gap between the opposition full-back and centre-back operate in the most dangerous zone on the pitch. That's where the 0.35+ xG chances and the cut-backs come from.
You can see the difference in the quality of the chances a player creates, not just the quantity:
| Player | Key passes | xA | xA per key pass | Profile |
|---|---|---|---|---|
| Groß (BHA) | 15 | 2.33 | 0.16 | Half-space creator |
| Ødegaard (ARS) | 12 | 1.97 | 0.16 | Half-space creator |
| Rogers (CHE) | 11 | 1.80 | 0.16 | Half-space creator |
| Xhaka (SUN) | 14 | 1.40 | 0.10 | Deep distributor |
| B.Fernandes (MUN) | 13 | 0.86 | 0.07 | Volume, lower quality |
📌 Understat key passes and FPL xA, 2026/27 through GW5. Five-match samples: read the shape, not the decimals.
Fernandes has created nearly as many chances as Groß and fewer than half the expected assists. That isn't a criticism of the most reliable points-scorer in the game; it is simply a reflection of where his chances come from. For Role Watch, the question is always which kind of creator a role change is turning someone into.
III. The anchor effect: teammate dependency
A player's fantasy ceiling is rarely set in isolation. It is usually unlocked (or capped) by the player standing fifteen yards behind him.
When a team runs a lightweight, dual-roaming double pivot, both midfielders have to temper their forward runs to protect the rest-defence: someone has to stay home when the ball is lost. The moment a dedicated, physical holding midfielder enters the XI, the other one is released. His job description changes from "one of two who might go" to "the one who goes".
That makes the team sheet a leading indicator in its own right. When you're watching an attacking midfielder, you're also watching the player behind him. Our Predicted Lineups page is the quickest way to see whether the anchor is expected to start before the deadline.
- Anchor comes in → the #8 is freed: expect more box arrivals, higher shot volume, a falling build-up share.
- Anchor goes out (injury, rotation, suspension) → the #8 is pulled back: expect the reverse, often within a single match.
- Anchor is an FPL asset too: since 2025/26, midfielders earn 2 points for 12 defensive actions in a match. Bentancur is averaging 14.59 per 90 with four defensive-contribution points already; Xhaka is at 10.8 with four.
IV. Counter-press proximity
When the ball is turned over, where is your asset standing? If he's the first line of the counter-press in the final third, he benefits from transition returns: winning the ball back 25 yards from goal against a defence that's still facing the wrong way is one of the highest-converting situations in modern football.
The tell in the data is an attacking player with an unusually high defensive workload and a low build-up share. Tavernier fits the profile: 8.92 defensive actions per 90 (more than many holding midfielders), goals in three of his five matches, and the lowest build-up share of anyone on our shortlist below. He isn't building attacks; he's finishing them, often after winning the ball back himself.
V. The hierarchy behind the ball
The fifth pillar isn't about movement. It's about pecking order: who takes the penalties, the corners and the direct free-kicks, and what happens to that order when a teammate comes off, gets injured or is sold. Set-piece hierarchies change far more often than the templates notice, and they change silently: nobody publishes a press release when the left-footed corner taker is benched.
It also works as a check on everything above. Groß is listed as Brighton's primary penalty taker, yet his 0.98 xG this season is identical to his non-penalty xG: every bit of it has come from open play. The penalty is upside his underlying numbers haven't started counting. For a primary taker like Saka, always check how much of the xG is non-penalty before calling a spike a role change.
3. Case Study: The Brighton Midfield Laboratory
Brighton & Hove Albion are this season's textbook study in how a role, rather than a reputation, drives fantasy output, and the whole story runs through Groß.
For years, casual managers have filed him as a steady, low-ceiling midfielder whose output leans on dead-ball deliveries. His deployment this season says something very different.
Fluid 6–8–10 mobility
Groß isn't playing one position. In the 6 phase he drops deep to start possession from the centre-backs, using his passing range to bypass the first pressing wave. In the 8 phase, as the ball moves forward, he slides diagonally into the right half-space and finds the pockets between the opposition's midfield and defensive lines. In the 10 phase, when the ball reaches the final third, he arrives in the box as a primary receiver, occupying positions you'd normally associate with a second striker.
 HOW GROSS MOVES THROUGH A BRIGHTON ATTACK
 │
 ├── PHASE 1 · BUILD-UP (the 6)
 │     Drops beside the centre-backs to collect and beat the first press
 │
 ├── PHASE 2 · PROGRESSION (the 8)
 │     Slides diagonally into the right half-space, between the lines
 │
 ├── PHASE 3 · TERMINAL (the 10)
 │     Arrives at the penalty spot or the cut-back zone as a receiver
 │
 └── WHAT MAKES IT SAFE
       A fixed #6 who does NOT follow the ball forward
       Andrés: 10.73 defensive actions per 90 so far
The data footprint
The numbers back up every stage of that:
| Groß | 2025/26 | 2026/27 (GW1–5) | Change |
|---|---|---|---|
| Non-penalty xG per 90 | 0.07 | 0.20 | ×2.8 |
| xA per 90 | 0.18 | 0.47 | ×2.6 |
| Key passes per 90 | 2.1 | 3.0 | +40% |
| Shots per 90 | 1.0 | 2.0 | ×2.0 |
| Build-up share | 83% | 41% | −42 pts |
| FPL points per 90 | 4.3 | 9.4 | ×2.2 |
📌 Understat (xG, xA, key passes, shots, build-up share) and FPL points. 2025/26: 1,635 Understat minutes. 2026/27: 450 minutes.
Twice as many shots, far more of the dangerous passes, and less than half of his involvement now ending in build-up. That's the signature of a player whose job has moved up the pitch. Through five gameweeks, his 2.33 xA is the most of any regular midfielder or defender in the league (360+ minutes), his rise in xGI per 90 is the largest of any of them with a meaningful sample last season, and his 47 points put him top of all 199 midfielders. None of it has come from penalties.
The anchor: an honest correction
The neat version of this story goes: Brighton found a proper holding midfielder, the holding midfielder freed Groß, and Groß exploded. The minutes don't quite allow it:
| Player | GW1 AVL | GW2 CHE | GW3 LEE | GW4 COV | GW5 ARS |
|---|---|---|---|---|---|
| Groß | 90 | 90 | 90 | 90 | 90 |
| Gómez | 85 | 90 | 90 | 83 | 85 |
| Ayari | 63 | - | 90 | 90 | 90 |
| Yalcouyé | 4 | 73 | 90 | 64 | 5 |
| Andrés | - | - | - | 25 | 84 |
| Groß's points | 2 | 13 | 1 | 17 | 14 |
📌 Minutes played, from FPL match data. Positions within the midfield aren't recorded, which is exactly why you have to watch the matches.
Groß's surge started before Chema Andrés arrived. His 13-pointer at Chelsea came alongside Malick Yalcouyé, and his 17 at Coventry came with Yasin Ayari and Yalcouyé starting and Andrés on for the last 25 minutes (he assisted). Brighton have rotated the players around Groß almost every week, with Diego Gómez the only other constant. Whatever released Groß was in place from the opening weeks. That's exactly why the managers who read the role, rather than the teamsheet, were in at £5.5m.
So where does Andrés fit? He's the evidence that the role is sustainable. On his first start against Arsenal in GW5 he played 84 minutes, scored, and crucially for Groß, looked like the fixed #6 the structure needs. His 10.73 defensive actions per 90 are the profile of a genuine anchor: disciplined, positional, the man who cleans up second balls and stays home when the ball is lost. Groß scored 14 points in that match.
Here's the Role Watch edge that's still live. Our model projects Andrés for just 3.52 points over the next six gameweeks, meaning it doesn't yet expect him to be a regular starter. If he does keep the shirt, the structure protecting Groß's forward role is more secure than the projections assume. If he drops out, watch Groß's box arrivals closely over the next two matches before you panic, because the surge began without him.
Where the numbers are now
Our engine now projects Groß for 28.16 points over GW6–11. That's fifth among all midfielders, behind Fernandes (£11.9m), Saka (£9.5m), Semenyo (£8.4m) and Mbeumo (£7.9m). At £5.8m, he's the cheapest of the five by more than £2m. The algorithm has caught up. The window for buying him as a differential has closed; he's now template, which makes him a shield rather than an edge (see the effective ownership section of The Elite Edge).
Brighton had a second role story, and the elite read it even faster. Maxim De Cuyper is a left-back whose numbers look like a winger's: 1.48 xG and 1.16 xA from defence, alongside just 3.4 defensive actions per 90 because he spends very little of his time defending. Top-1,000 ownership jumped from 34.4% at the GW2 deadline to 67.4% at GW3, and he's already risen four times, to £4.9m.
4. Reading the Visual Toolkit: Heat Maps vs Reality
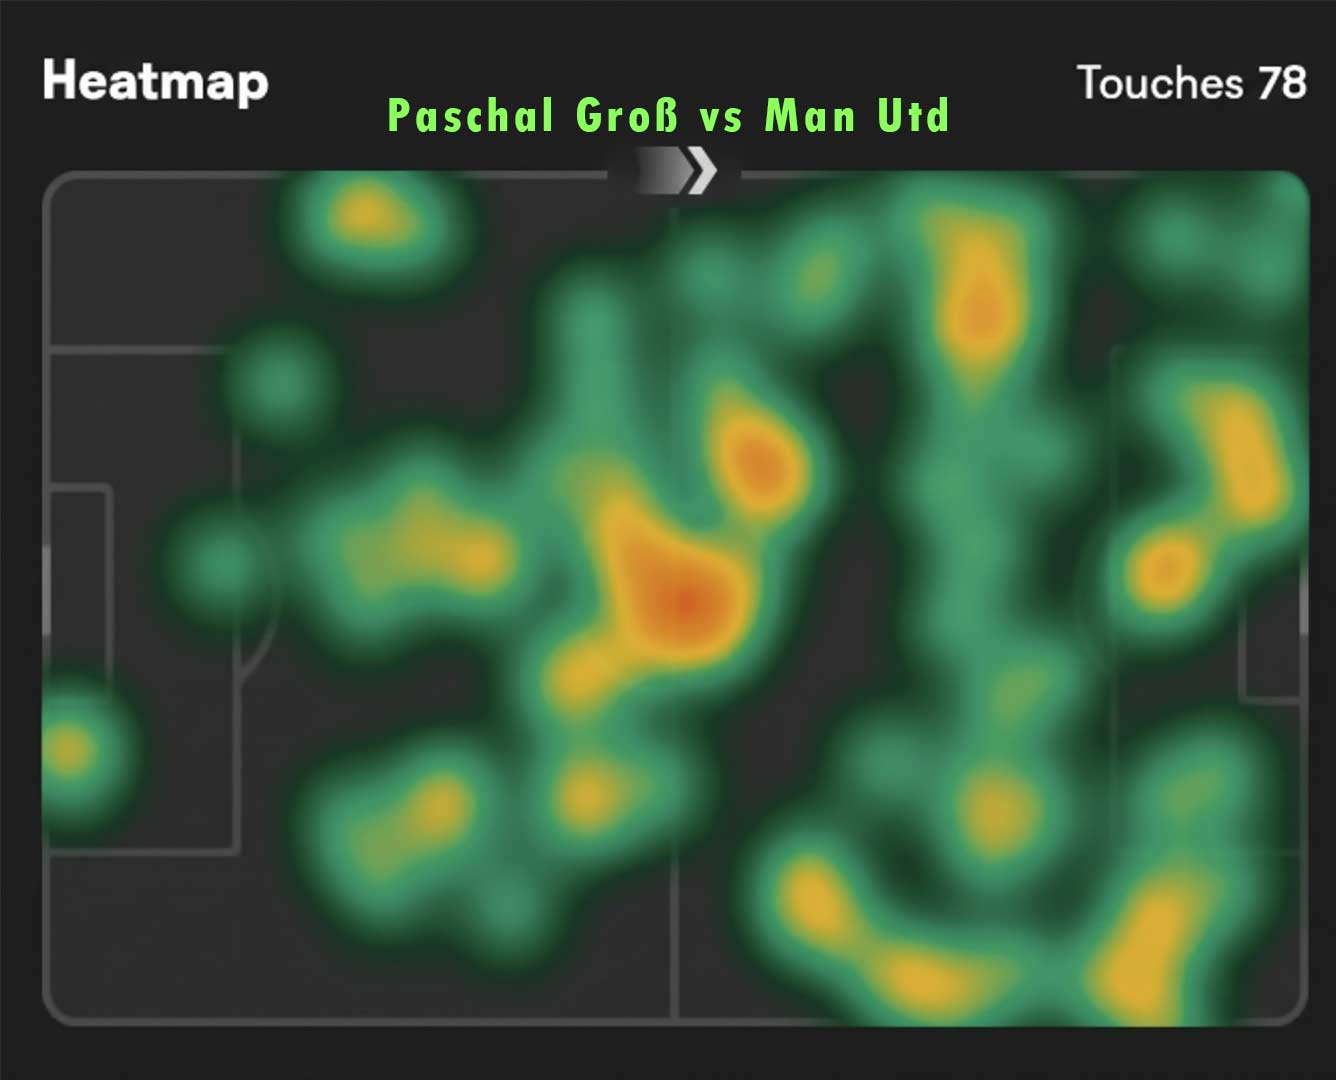
After a match, most managers glance at a heat map and draw a conclusion. The trouble is that a heat map shows where a player was, not what he was doing there or which phase of play he influenced. Here's what the casual reading misses:
| Metric / visual | What the casual manager sees | What the role watcher asks |
|---|---|---|
| High central heat map | "He's playing deep. Avoid." | Is it bimodal? A dense block in his own half plus a cluster inside the box is the signature of a late-arriving #8. |
| High touch volume | "He's heavily involved. Great pick." | Where were the touches? Seventy in his own half generate almost no xGI; twenty between the lines and in the box generate most of it. |
| Progressive passes received | Ignored in favour of passes played | The truest measure of a player finding space: it counts how often he receives the ball facing goal in an advanced pocket. |
| xGChain | Rarely checked at all | Split it. Build-up share tells you whether his involvement ends before the danger zone or inside it. |
| Low shots, high xA | "Not a goal threat." | Check xA per key pass. High means cut-backs and through balls; low means crosses into a packed box. |
| Subbed off before 70 minutes | "The manager doesn't trust him." | Often a stamina tax on a high-work-rate hybrid role. It trims appearance and bonus points, not necessarily the role itself. |
That last row matters more than it looks. A player leading the press and covering box-to-box ground is the most likely to come off around the hour mark, and the model's expected minutes will quietly reflect it. Check them on the Points Matrix before you assume a role change also means 90-minute security. It often doesn't.
5. The Classic Role Watch Archetypes
Once you train your eye to watch roles rather than shirts, the same patterns keep recurring across the league. Learn to recognise these five and you'll see most role changes coming.
The decoy winger vs the terminal winger
Watch the two flanks against each other. Very often one winger is an isolator, hugging the touchline to draw a double team, while the winger on the opposite side is told to come inside and attack the back post. The isolator racks up crosses that get headed clear; the back-post winger racks up tap-ins. On the FPL site their basic numbers can look almost identical until you look at where their shots come from. The tell: the terminal winger has a low build-up share, high shot volume and high xG per shot. The decoy has the reverse.
The inverted full-back push
When a full-back inverts into central midfield in possession, look at what happens to the interior midfielder on his side. He's usually pushed higher, into the forward line, as an extra attacker. Tracking a full-back's inversion is often the quickest way to predict an attacking midfielder's goal surge well before the midfielder's own numbers move.
Gvardiol is the model inverted defender in the data: 88% of the xG he touches comes from build-up, the profile of a player who spends his possessions in midfield rather than on the overlap. Brighton's Ferdi Kadıoğlu is the one to watch now: his involvement so far is modest (0.25 xGChain per 90), and a jump in his build-up volume would be the early warning that Brighton are using him to push a midfielder higher.
The auxiliary winger at full-back
De Cuyper's archetype: a full-back or wing-back whose side attacks down his flank and trusts the rest of the back line to cover. The signature is a defender with meaningful xG and a low defensive-action count. He's the most efficient asset type in FPL when it works, because he collects attacking returns at defender prices and still has a clean-sheet floor. The risk is the mirror image: when the manager decides he's defending too little, the role can be switched off in a single team talk.
The anchor as an asset
Since defensive contribution points arrived, the holding midfielder isn't just the man who frees your attacker; he can score on his own terms. Bentancur and Xhaka both have four defensive-contribution points already. Xhaka adds a creative layer on top (1.40 xA), which is why a £5.5m holding midfielder has outscored several £7m attackers. Role Watch cuts both ways here: when a team drops a deep playmaker for a pure destroyer, the destroyer's defensive-contribution numbers often move before anyone's projections do.
The pulled-back playmaker
The most expensive archetype to miss: an attacking midfielder whose side has lost its anchor, or changed shape, so he now drops to collect the ball. His touches go up, his heat map looks busy and his name still carries its old price. His build-up share climbs and his threat falls. That's the next section.
6. The Other Side: Role Watch as a Sell Signal
Everything above can be read in reverse, and the sell signal is often the more valuable one. A price rise costs you £0.1m for being late. Holding an asset whose role has quietly been switched off costs you points every week until the model notices.
| Player | Price | Owned | Build-up share | Threat per 90 | What changed |
|---|---|---|---|---|---|
| Rice (ARS) | £7.4m | 11.9% | 70% → 96% | 0.34 → 0.14 | Pulled into build-up |
| Wirtz (LIV) | £7.3m | 5.8% | 52% → 73% | 0.48 → 0.31 | Dropping to collect |
📌 Understat, 2025/26 vs 2026/27 through GW5. Threat per 90 = non-penalty xG + xA per 90.
Rice is the clearest example in the league. Nearly all of his involvement now ends in build-up, and his attacking threat has fallen by more than half. His points haven't collapsed (20 so far), partly because his role now earns defensive-contribution points: 9.2 defensive actions per 90. But that's a £5.5m route to points at a £7.4m price. Xhaka earns the same kind of points for £1.9m less. The elite have already moved: Rice is in 0.2% of top-1,000 squads, against 11.9% of all managers.
The general rule: when a player's build-up share climbs and his threat falls for three or more matches, don't wait for the xG to "correct". The role has changed. The xG is telling you so.
7. The Current Role Watch Shortlist
Here's the same screen that found Groß, run across every midfielder and defender with 360+ minutes this season: the biggest rises in xGI per 90 against last season, filtered to players the crowd hasn't bought yet.
| Player | Price | Owned | xGI/90 last | xGI/90 now | Build-up | Top-1k | xP 6GW |
|---|---|---|---|---|---|---|---|
| Ødegaard (ARS) | £6.8m | 19.8% | 0.41 | 0.73 | 32% | 16.3% | 18.4 |
| Tavernier (BOU) | £6.1m | 6.7% | 0.46 | 0.67 | 26% | 4.5% | 25.5 |
| Enciso (IPS) | £5.5m | 0.8% | 0.38 | 0.54 | 41% | 0.2% | 22.2 |
| Dewsbury-Hall (EVE) | £6.6m | 6.0% | 0.37 | 0.52 | 51% | 4.6% | 21.8 |
| Iwobi (FUL) | £5.4m | 0.7% | 0.22 | 0.51 | 75% | - | 16.9 |
| Leif Davis (IPS) | £4.0m | 6.9% | 0.22 | 0.48 | 42% | 12.5% | 18.7 |
| Tyrick Mitchell (CRY) | £4.5m | 6.0% | 0.14 | 0.34 | 44% | 3.2% | 10.6 |
📌 xGI/90 last = Understat non-penalty xG + xA per 90 in 2025/26; 'now' = FPL xG + xA per 90 through GW5. Build-up = this season's build-up share. Top-1k = share of the top 1,000 overall owning him at the GW4 deadline ('-' = unowned or below capture threshold). xP 6GW = FPL King projection, GW6–11. Davis and Mitchell are defenders.
Treat this as a watchlist, not a buy list. Five matches is exactly the sample size where variance and role change look identical in a spreadsheet, and that's the point: the table tells you where to point your eyes, and the eye test tells you which is which.
A few read-throughs. Tavernier is the purest terminal profile here, combining the lowest build-up share and a high defensive workload with goals in three of five matches, yet he's in only 4.5% of elite squads. Ødegaard's threat has jumped by 0.31 per 90 with most of his involvement now ending in the final third, yet the top 1,000 own him less than the average manager does. Iwobi's rise comes with a 75% build-up share, so he's a deeper creator than the xGI suggests: check whether his box arrivals are real before you pay for them. Having two Ipswich players on one shortlist (Enciso and Davis) is worth a close look at the team's wider shape rather than just the individuals. For Davis, a £4.0m defender with 1.75 xG, check whether it's set-piece headers or overlapping runs before trusting it. That's step three of the checklist below.
There's an international break before the GW6 deadline on 10 October. That's two weeks to watch the tape, check the lineups and do the work before the market does.
8. The Role Watch Execution Checklist
Before your next transfer, run the target through this filter. Role Watch tells you who to buy; deadline discipline (covered in section 6 of The Elite Edge) still tells you when.
The seven checks
- Has the personnel around him changed? Check whether an anchor has come in or gone out, and whether he's expected to start.
- Where does he register touches in Phase 3? Build-up involvement is only a problem if it stops him arriving in the box. Build-up share tells you which.
- Are the returns open play or dead ball? Compare npxG with xG, and check xA per key pass.
- Is the physical demand sustainable? Look at the substitution pattern around 60–70 minutes, and at the model's expected minutes.
- Has the market already paid for it? Check Price Change Predictions and the elite ownership trends: under ~20% top-1,000 ownership, you're early; over ~60%, it's the template.
- Does the fixture suit the role? A terminal #8 against a low block is a different asset from the same player against a high line: check the attacking side of Fixture Difficulty.
- Write down what would prove you wrong. If the anchor is dropped or the box arrivals disappear for two matches, the thesis is dead: sell on the role, not on last week's points.
 ROLE WATCH: SHOULD I BUY?
 │
 ├── 1. Has the role actually changed? (personnel, shape, Phase 3 touches)
 │     └── NO  ──▶ It's variance. Let the model handle it.
 │
 ├── 2. Is the output open play? (npxG ≈ xG, xA per key pass ≥ ~0.12)
 │     └── NO  ──▶ You're buying the set-piece job, not the role.
 │
 ├── 3. Is the role protected? (anchor behind him, no hour-mark hook)
 │     └── NO  ──▶ Discount the ceiling for minutes management.
 │
 ├── 4. Has the market already paid for it?
 │     ├── Top-1k > 60% ──▶ It's the template now: buy it as a shield.
 │     └── Top-1k < 20% ──▶ This is the Role Watch window.
 │
 └── 5. What would prove me wrong? Write it down before you buy.
The Takeaway
Expected data isn't wrong; it is simply late. It is slow by design, because a model that reacted to every five-match spike would be worse, not better. The edge lives in the gap between when a role changes and when the numbers are allowed to believe it.
Groß shows how wide that gap can be. The managers who read his new job were in at £5.5m, before the three rises, before the 670,000 transfers, and in time for 45 of his 47 points. The managers who waited for the algorithm bought the same player at £5.8m, as template, to protect themselves against everyone else who owned him.
Numbers quantify the past; roles forecast the future. When you can see a tactical shift in real time, you get the rarest commodity in Fantasy Premier League: points you saw coming that the algorithm couldn't.
FPL King
Prediction Engine Team
Written by the team behind FPL King's prediction engine, turning bookmaker odds, xG modelling and squad optimisation into plain-English advice.
Comments
Comments disabled