
Live Stat Visualisations
FPL Stat Charts
Interactive scatter charts built on live player and team data — spot value picks, elite underlying numbers, DEFCON magnets, template ownership battles and team strength at a glance.
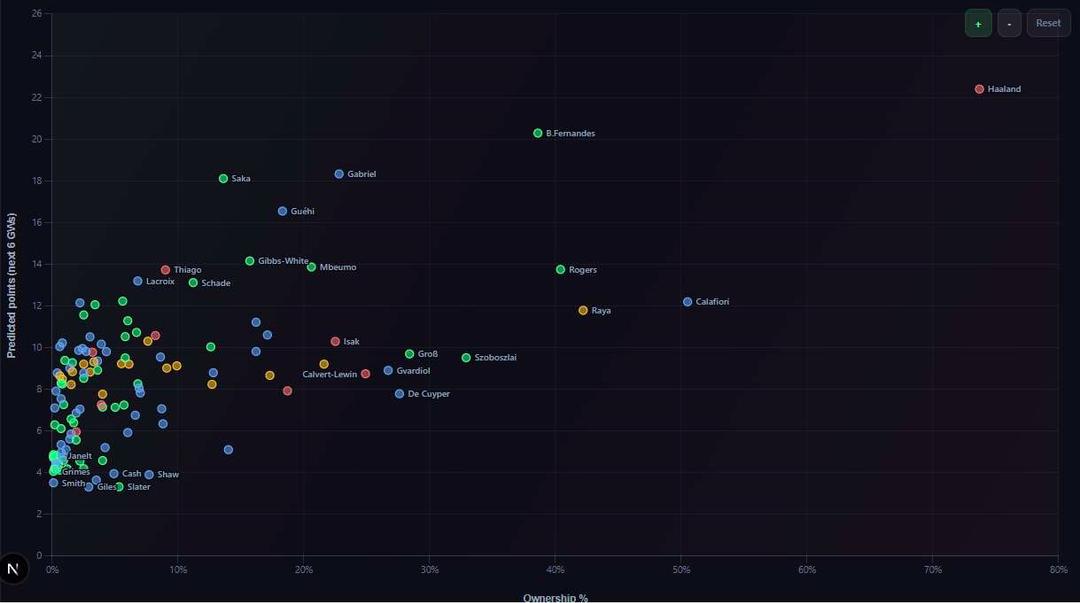
Differential Finder
Predicted Points vs Ownership
Our DC Predictor Engine's expected points for the upcoming gameweeks against current ownership. Top-left = high ceiling, barely owned.
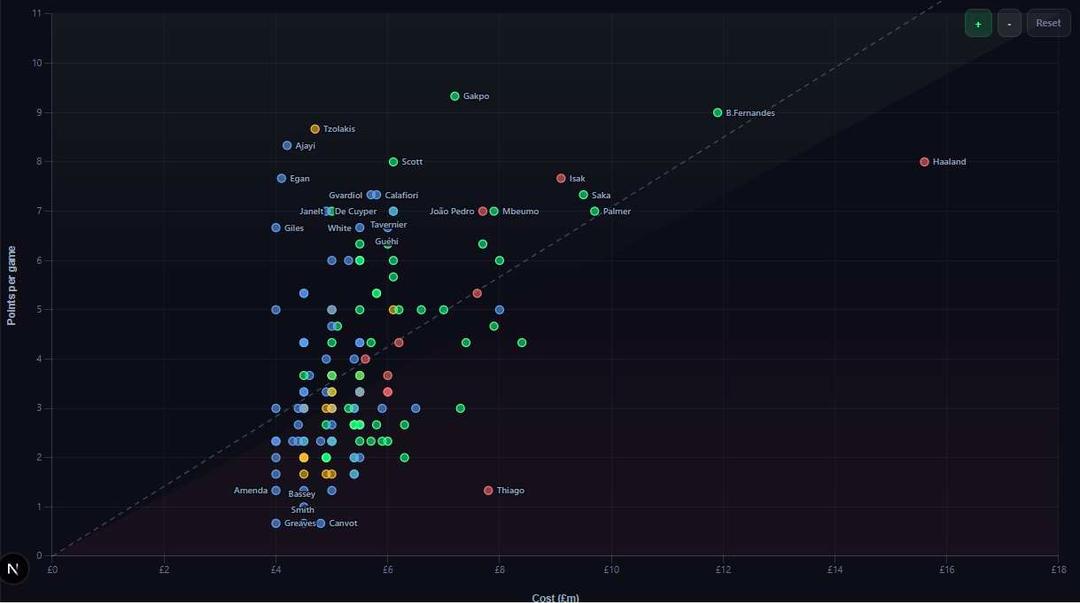
Value For Money
Points per Game vs Cost
Who's actually earning their price tag? Players above the dashed line return more points per game than the league-average rate for their cost.
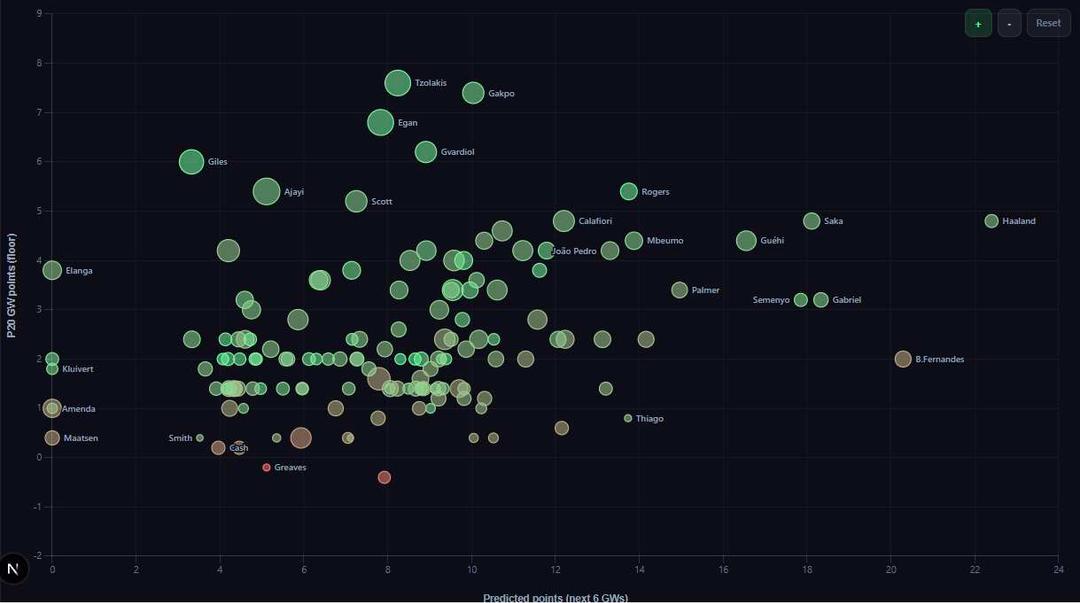
CV Consistency
Predicted Points vs Reliable Floor (CV-Colored)
A future-focused consistency view: x-axis is predicted points over the next 6 gameweeks, y-axis is your bad-week floor (P20), and color is coefficient of variation (CV) so greener means steadier week-to-week returns.
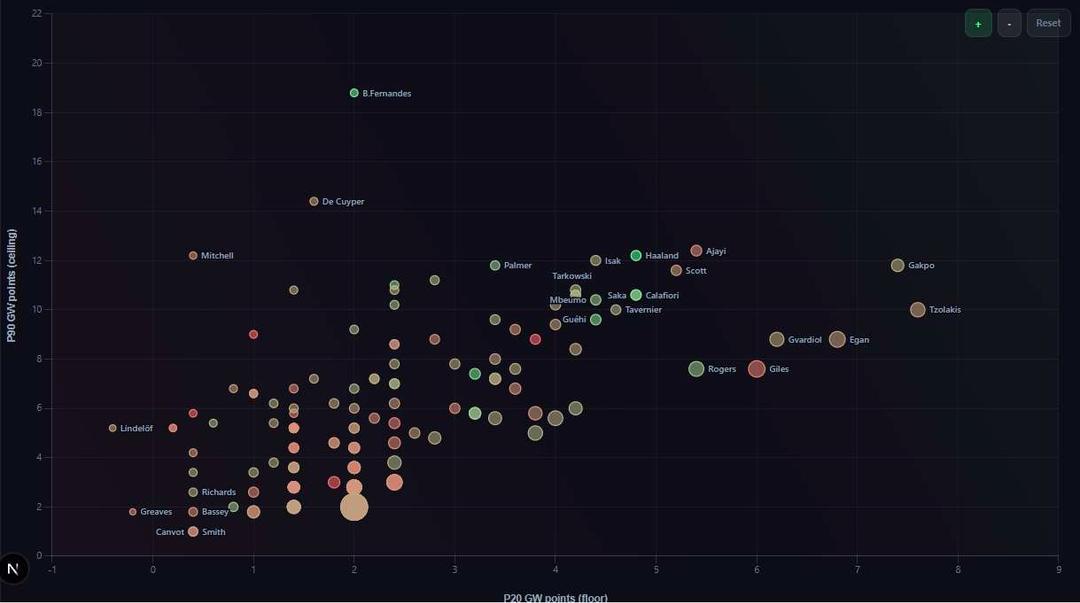
Consistency
20th-Percentile Floor vs 90th-Percentile Ceiling
A robust floor-vs-ceiling view: x-axis is the 20th-percentile gameweek score (bad-week floor), y-axis is the 90th-percentile score (strong-week ceiling), with bubble size based on consistency.
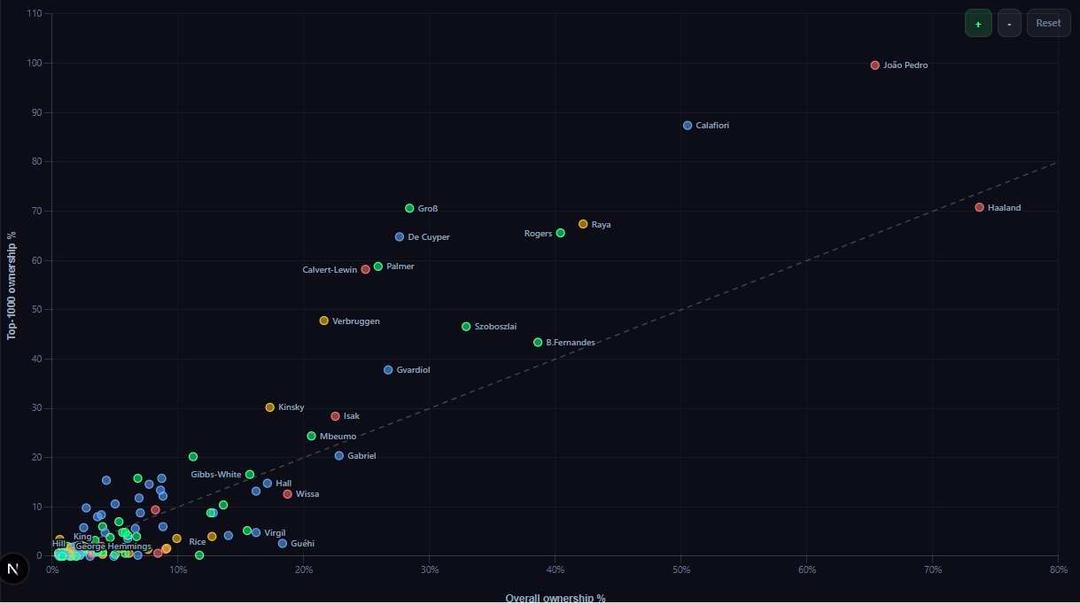
Template Battle
Overall Ownership vs Elite Manager Ownership
Top-1000 manager ownership against whole-game ownership. Above the dashed line = elite managers are onto it before the crowd; below = the public owns it more than the elites do.
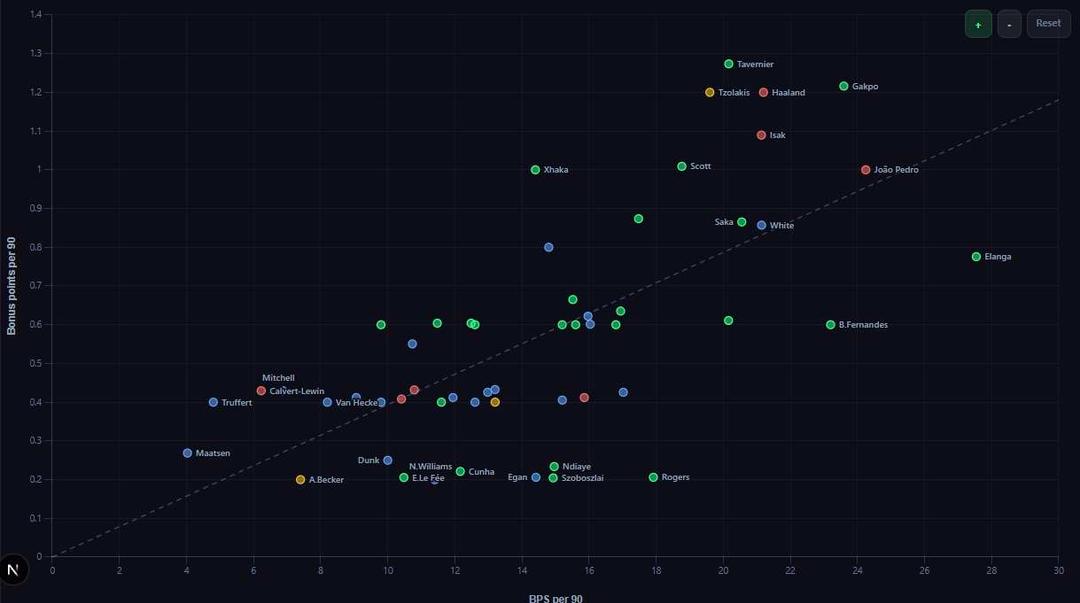
Bonus Magnets
Bonus Points System (BPS) per 90 vs Bonus per 90
Above the dashed line = winning more bonus than their BPS rate typically earns (a little lucky, due a cool-off); below = the bonus-point system owes them, due a correction.
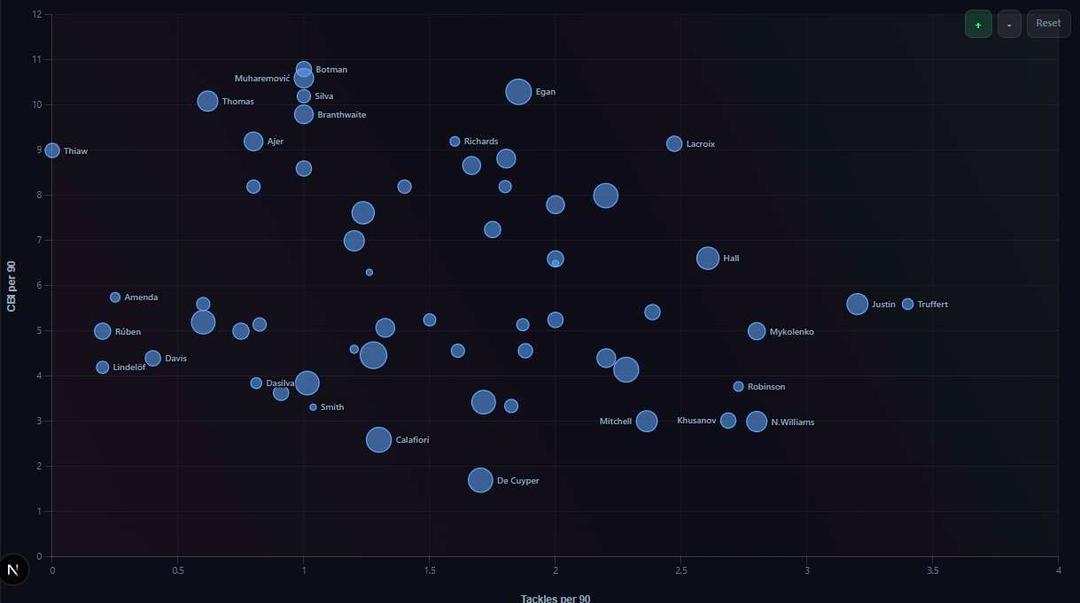
DEFCON Watch
Clearances/Blocks/Interceptions per 90 vs Tackles per 90
Which defenders rack up the defensive-contribution counts that pay 2 extra points? Bubble size = FPL points so far this season.
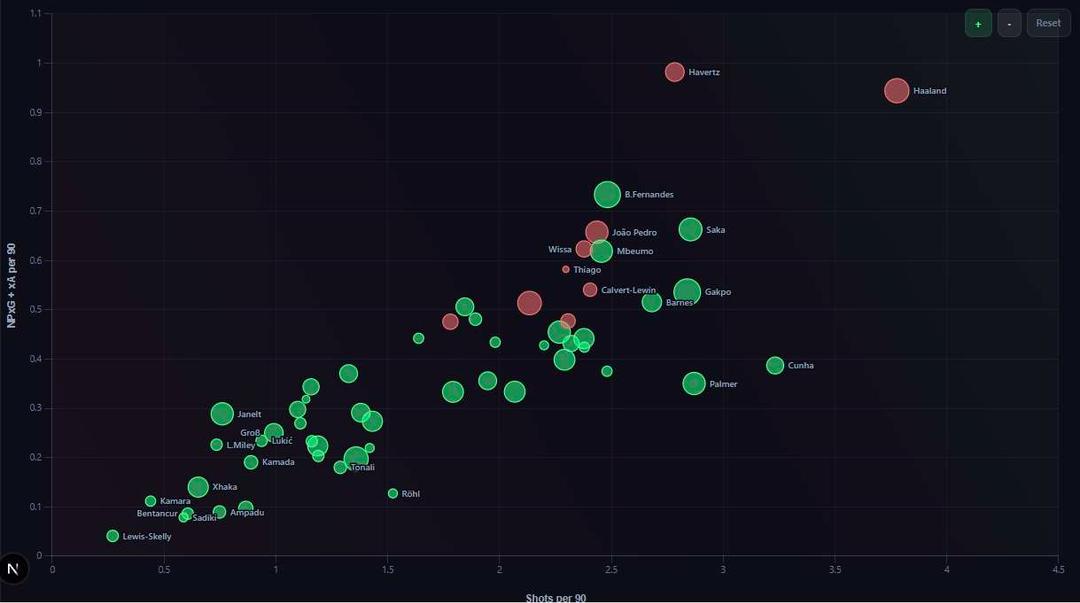
Attacking Threat
NPxG + xA per 90 vs Shots per 90
Underlying attacking output: shot volume against non-penalty expected goals plus expected assists. Top-right is elite territory.
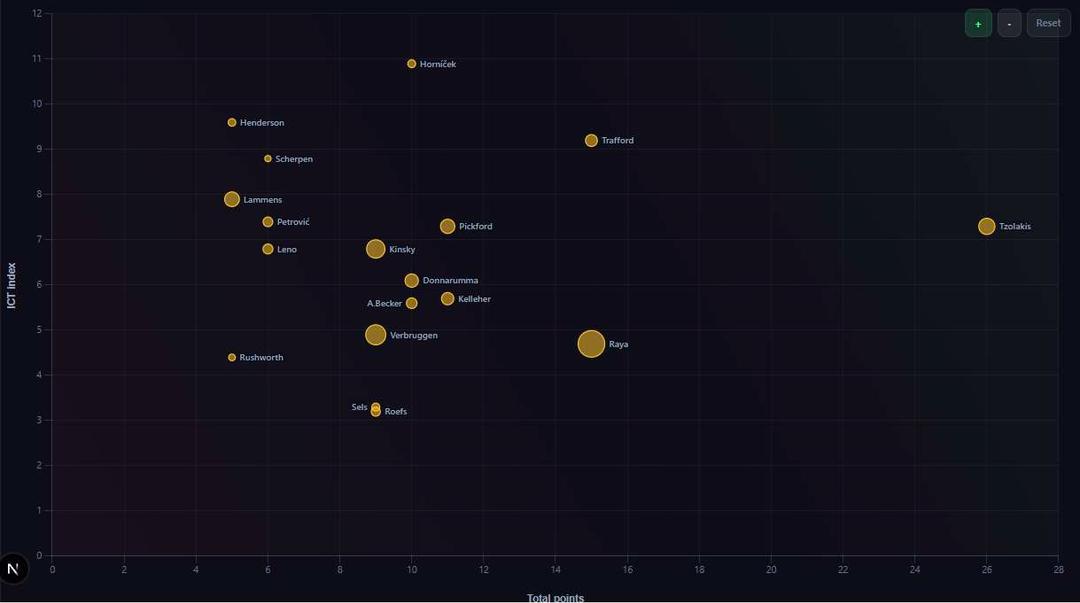
Goalkeeper's ICT
Goalkeeper's ICT
Goalkeeper output so far: total FPL points against cumulative ICT index. Bubble size = ownership, so big low bubbles are the crowd's mistakes.
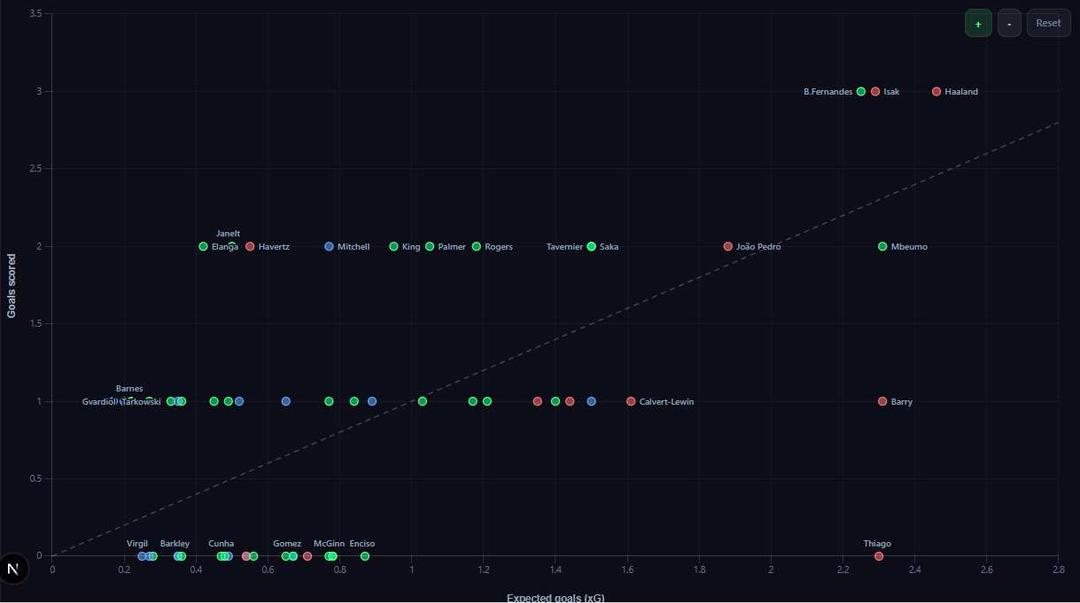
Finishing Watch
Goals vs Expected Goals
Above the dashed line = scoring more than the chances deserve (due a cool-off); below = unlucky finishers due a correction.
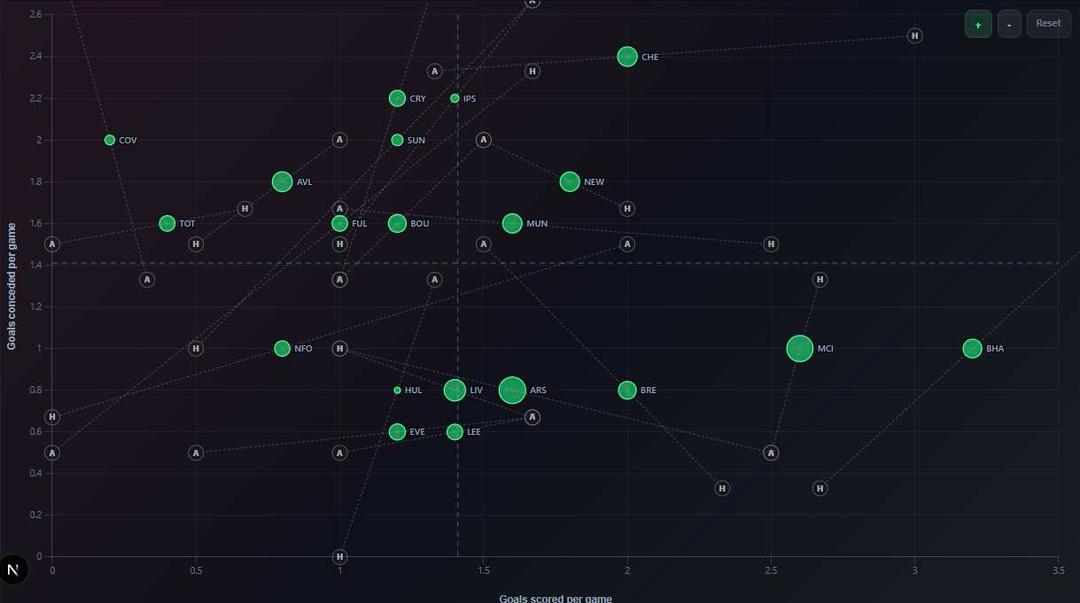
Team Strength
Team Attack vs Defense
Goals scored vs goals conceded per game, this season. Bubble size = current Club Elo rating — bottom-right teams are the ones to load up on at both ends (score a lot, concede little); top-left teams to fade.
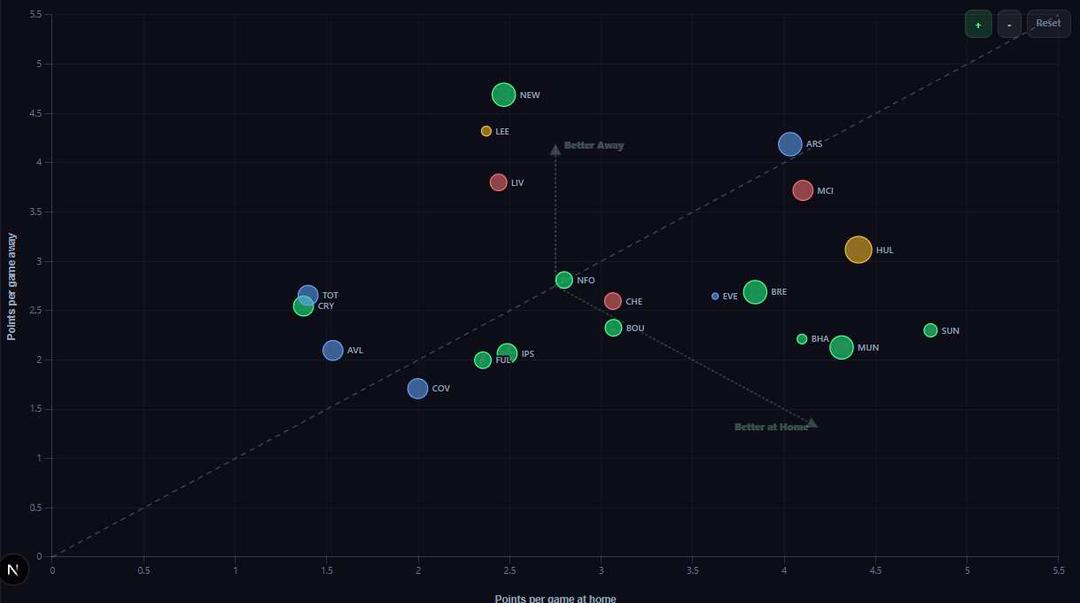
Home & Away Splits
Position Points: Home vs Away
Average FPL points per appearance for each team's goalkeepers, defenders, midfielders and forwards, split by venue. Above the dashed line = that unit scores more away from home; below = they're stronger at home.

Season Fixture Shape
Season Shape: Fixture Difficulty by Gameweek
Every Premier League team's fixture difficulty across the full season, GW1-38 — full-width per team, with the league-average line and each team's best and worst six-gameweek run highlighted.
Budget Saviors
Budget Saviors: DEFCON per £m vs Ownership
Defensive-contribution output per £m spent against ownership — top-left is the sweet spot: cheap DEFCON earners almost nobody owns yet.
Shot Volume & Conversion
Shot Volume vs Conversion: Midfielders & Forwards
Shots per 90 against conversion rate (goals per shot) for midfielders and forwards — top-right shoots often and finishes clinically; bottom-right shoots often but wastes most of it.
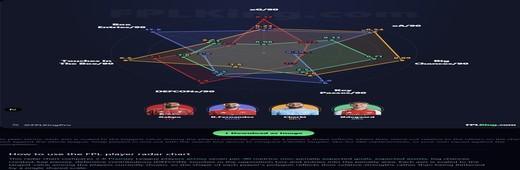
Player Comparison
Player Radar: Compare 2-6 Players
A per-90 radar comparing xG, xA, big chances created, key passes, DEFCONs, touches in the box and box entries for 2-6 players — swap anyone in via search.
Interactive FPL charts for better transfer decisions
FPL King's Fantasy Premier League charts turn player and team statistics into practical transfer shortlists. Compare predicted points with ownership to find differentials, points per game with price to identify value, and expected goals or attacking threat to assess whether recent returns are sustainable. Every player chart includes filters for position, price and recent minutes where relevant.
The collection also covers DEFCON defensive contributions, goalkeeper ICT, bonus points, scoring consistency, elite-manager ownership and Premier League team strength. Use the charts alongside the six-gameweek fixture tickers and ranked picks, then confirm expected minutes and squad fit before making a transfer.